Informing decisions through data analysis and interpretation
I am a product analyst at Square with experience at a big technology consulting firm and a small series B startup. I have an MS from Berkeley and a BS from Carnegie Mellon. I use data to inform decisions.
I was in the Energy, Civil Infrastructure, and Climate program in UC Berkeley's Civil Engineering department. I studied civil systems, climate change, transportation, optimization, energy law and policy, and human impact the environment.
With a double major in Engineering and Public Policy, my tenure in the Civil & Environmental Engineering department at CMU included a diverse set of classes. I studied traditional civil engineering, the environmental impact of civil projects, engineering economics, and public policy related to heavy civil projects.
I worked on a project for Justine Burt & Associates to determine why small to medium sized businesses implement sustainability practices. I researched businesses that were early adopters of sustainability practices, identified key stakeholders, connected with companies, and collected data.
I worked on a team of four to provide a source of electricity to underprivileged villages in India. I collected data on the electricity needs and devised a sustainable business plan. The solution was a set of solar cells incorporated into roof panels to provide affordable in-house energy. The roof panels were made of composite waste material (mostly coconut fiber and recycled cardboard).
I studied the environmental impact of various modes of transportation using LCA (Life-Cycle Assessment). I then used the LCA data to make recommendations for transportation policy with GHG, energy, and pollution metrics as the main indicators of how sustainable a certain transportation method was.
After passing the NCEES Civil Engineering FE (Fundamentals of Engineering) exam, I interned with Professional Publications, INC. I wrote example problems for FE and PE exams, checked calculations, and organized materials for the next edition of the exam prep book.
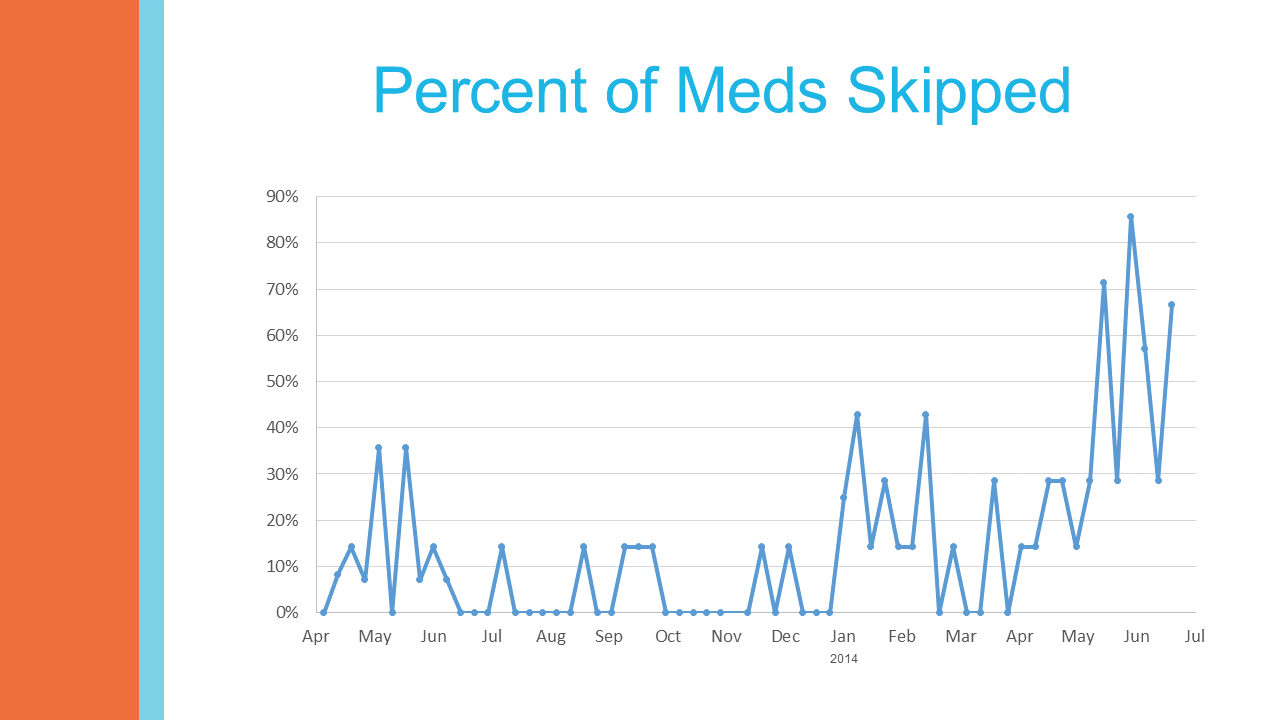
I started with medication adherence data for a single user. The data included a medication schedule for two different prescriptions, the time the medications were actually taken, and a marker when the medication was skipped.
The medications skipped visualization tells a story about the user. The user started off with a high percentage of skips in the first couple months then fell into a routine with fewer skips for a while. As the user approached the one-year mark on the medication, s/he began skipping more-- skips went from an average of 6% in 2013 to 28% in 2014.
The data show there could be an opportunity to help the user get into a routine with her/his medication schedule. Then over time, as adherence drops, the user needs to be re-engaged and may require extra incentives and reminders.
See more data visuals from this project here.


I have worked on four different projects as a senior business and systems integration analyst at Accenture. My responsibilities include data analysis, running reports, creating dashboards, coordinating testing, defect management, asset and content management, and informing decisions through data interpretation.